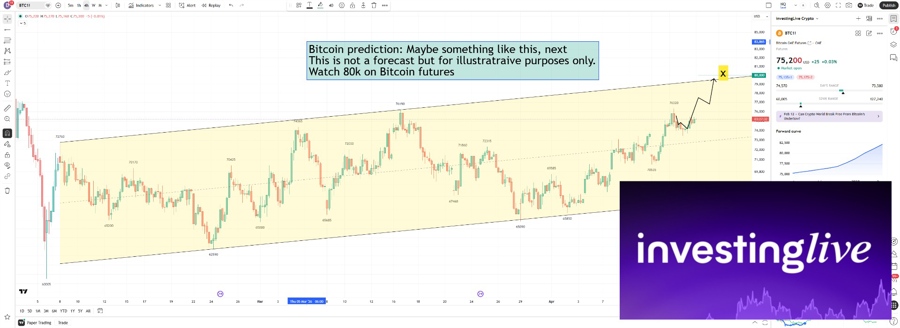
Bitcoin price prediction: Maybe something like this (watch $80k area on bitcoin futures)
Bitcoin Price Analysis on the Above 4h Chart: The Path to $80,000
The current technical setup suggests Bitcoin is entering a "price discovery" phase within its established ascending corridor. While the trend remains bullish, the $80,000 level represents more than just a round number—it is a critical psychological and structural resistance point.
1. The Ascending Channel Dynamics
As seen in the chart, Bitcoin has been bouncing between a series of higher lows (starting near $62,590) and higher highs.
The Support: The lower trendline has acted as a safety net, most recently holding firm around the $65,000–$68,000 zone.
The Mid-Line: The dashed median line in the yellow channel serves as the "equilibrium." Bitcoin is currently trading above this line, which signals strong momentum.
2. Why $80,000 is the "X" Factor
The target marked "X" on the futures chart aligns with the upper resistance of the multi-month channel. Reaching this level would require a breakout from the current local consolidation at $75,000–$76,000.
The Bull Case: A clean break above $76,320 (the previous local peak) would likely trigger a "short squeeze," as traders who bet against the rally are forced to buy back their positions, potentially catapulting the price toward $80,000.
The Institutional Play: With Bitcoin Futures trading at a slight premium, institutional sentiment remains cautiously optimistic despite recent geopolitical volatility.
3. "Illustrative, Not a Forecast"
The disclaimer in the chart is vital. Technical patterns are roadmaps, not guarantees. The channel is the more "reliable" element, the arrow with the path is illustrative. Why do I say "reliable"? Because if you are new to technical analysis, this art and science is not a crystal ball, and it is not guaranteed. Most of you al already know that. A pattern that plays itself out in 70% is amazing in terms of win rate.
Watch the pullback on bitcoin: The zig-zag arrow leading to the $80k target suggests that the path won't be a straight line. Investors should look for a "retest" of the $73,000 area to confirm it has flipped from resistance to support before the final leg up.
Volume is key: For the "80k prediction" to manifest, we need to see an increase in buying volume to pierce the top of the yellow channel.
Summary for crypto traders: Bitcoin is currently "holding the line" at $75,000. If it maintains this level, the structural "magnet" is the $80,000 resistance. However, a failure to hold the channel's mid-line could see a revisit to the $69,800 support before another attempt at the highs.
The Bottom Line: Keep your eyes on the futures. The $80,000 mark is the definitive "battleground" for the next phase of this bull market.
Key Takeaways for Today's Bitcoin Prediction at investingLive.com
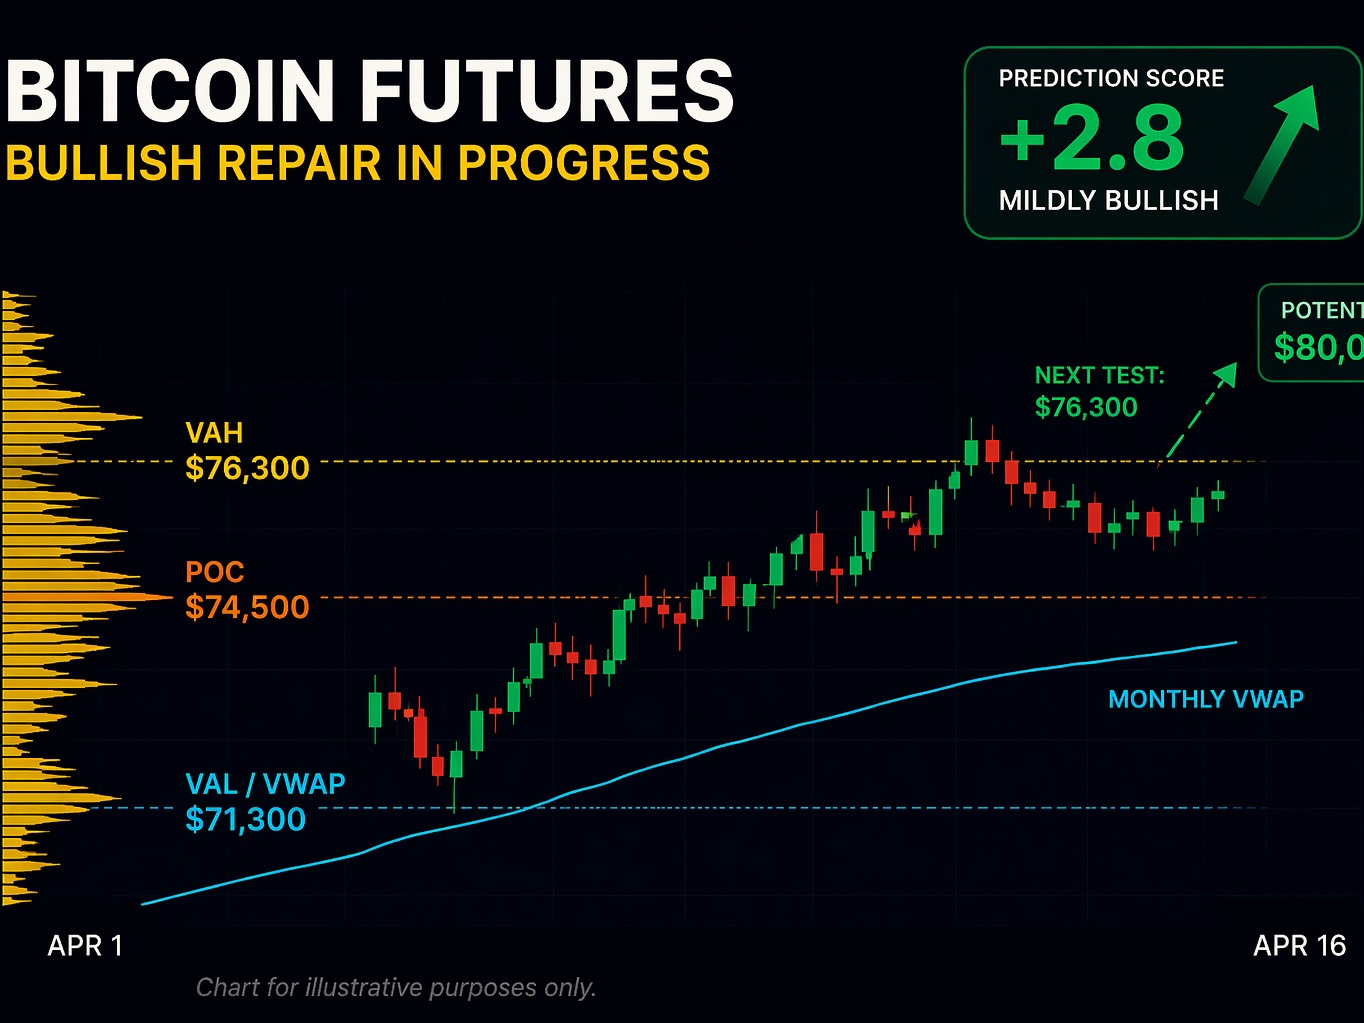
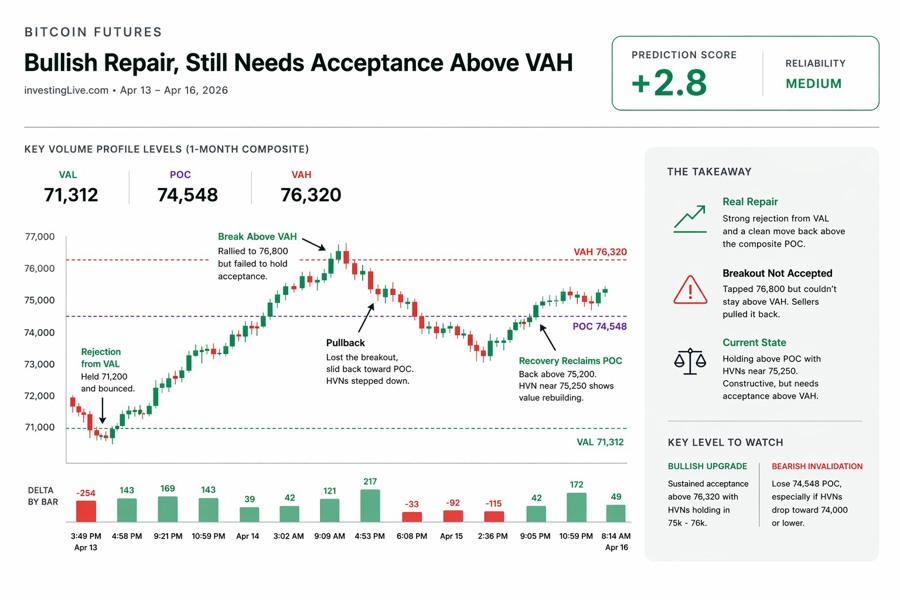
- Prediction Score: +2.8 (Mildly Bullish)
- Bitcoin futures have reclaimed the monthly POC near $74,500
- The market shows a bullish repair from $71K lows, not a full breakout yet
- $76,300 (VAH) remains the key resistance for bullish continuation
- A successful acceptance above that zone could open the path toward $80,000
- The rising monthly VWAP near $71,300 continues to act as structural support
Bitcoin futures are stabilizing after early-April weakness - but the real test is still ahead
Bitcoin futures are starting to look constructive again, and from my perspective, this is not just a random bounce. It is a structured recovery that traders should pay attention to.
Since the start of April, Bitcoin initially slipped from around $68,700 to approximately $65,900, shaking out weaker hands early in the month. But what followed is far more important than the drop itself.
The market reclaimed the monthly VWAP near $71,300, pushed back into the value area, and has now re-established itself above the Point of Control near $74,500. That shift tells us that price is no longer trading at a discount. Instead, it is now operating in a more balanced-to-constructive zone.
The chart included in this analysis highlights this evolution clearly. It shows how Bitcoin moved from lower value back into the upper half of the monthly range, with the key levels and value structure acting as a roadmap for price behavior.
Important note: The chart is for illustrative purposes only. It shows a potential path within a rising channel, not a guaranteed trajectory. Markets rarely move in straight lines.
The bigger story: from bearish pressure to bullish repair
What stands out most in this structure is the rejection of lower value.
Bitcoin futures tested the $71,300 area (monthly value area low) and quickly reversed. That is not something to ignore. When markets reject lower prices and move higher quickly, it often signals that sellers failed to gain control.
From there, Bitcoin climbed steadily:
- into the $72K–$73K zone
- then through the $74K area
- and eventually challenged $76,000+
This type of move is what traders call a value repair. The market is essentially saying: “we went too low, and now we are recalibrating higher.”
Even more important, the market managed to reclaim the $74,500 POC, which is the level where the most volume has traded this month. Holding above that level is typically a sign of improving structure.
Why this is still not a full breakout for the Crypto King (yet)
Now here is where the nuance comes in.
Bitcoin already attempted a breakout above $76,300, reaching roughly $76,800. But that move did not hold. Price rotated back lower, showing that buyers were not yet strong enough to maintain control above that upper boundary.
This matters.
Because of that failed breakout, the $76,000–$76,300 zone becomes a key decision area. Traders now know that sellers previously stepped in there. Until Bitcoin proves it can hold above it, that level remains a barrier.
So while the structure is bullish, it is still best described as:
Bullish repair with overhead congestion - not full bullish control
The $80K discussion: realistic target or premature optimism?
I have been discussing Bitcoin actively on social media over the past weeks, and one thing stood out clearly - a large number of participants were aggressively bearish, many even shorting into this recovery.
My response was simple: be careful, and protect your capital.
Those who have been following investingLive.com know that we have maintained a constructive-to-bullish view on Bitcoin for several weeks, even when sentiment was leaning the other way.
Now, does that mean Bitcoin goes straight to $80,000 from here? No.
Markets do not move in straight lines, and no one has a crystal ball.
However, from a technical perspective, the upper boundary of the current structure and channel points toward the $80K region as a potential target zone, not a guaranteed outcome.
For that scenario to become more realistic, Bitcoin needs to:
- break and hold above $76,300
- build acceptance above that level
- and avoid falling back into the middle of the range
If that happens, the path toward higher levels, including $78K–$80K, becomes much more credible.
Educational insight: why VWAP and value areas matter
For newer traders and investors, it is worth understanding why these levels matter.
- VWAP (Volume Weighted Average Price) shows where the average price is based on volume. When price is above a rising VWAP, it often reflects stronger demand.
- Value Area (VAL to VAH) represents where most trading activity has occurred.
- POC (Point of Control) is the price where the most volume has traded.
When Bitcoin moves:
-
from below value → into value → above value,
it often reflects improving sentiment and participation.
That is exactly what we are seeing now.
Technical scenario for Bitcoin: what to watch next
Bullish scenario (continuation toward $80K zone)
If Bitcoin futures:
- hold above $74,500
- and break above $76,300
then the market could shift into a stronger bullish phase, opening the path toward $78K–$80K over time.
Neutral scenario for Bitcoin futures (range continuation)
If price continues rotating between $74,500 and $76,300, the market may remain in consolidation before the next major move.
Bearish scenario Bitcoin futures (failed repair)
If Bitcoin falls back below $74,500 and fails to hold that area, the current recovery weakens. A deeper move toward $71,300 would then come back into focus.
Bottom line for Today's Bitcoin Analysis at investingLive.com
Bitcoin futures are in a better position than they were earlier this month. The market has repaired from lower levels and reclaimed key value areas.
But this is not a confirmed breakout yet.
Still, BTC futures have repaired meaningfully from lower value and are back in a constructive position above the 1-month composite POC (Point of control), but the market still needs to prove it can accept above the April's value area high VAH before we call this a stronger bullish takeover, and that is where the last stubborn short sellers get margin called.
The $76,300 level is the gate. Above it, the bullish case strengthens significantly. Below it, the market remains in a transitional phase.
The discussion around $80,000 is valid as a potential target, but only if the market earns it through acceptance and continuation - not speculation.
This analysis is for educational purposes only. Markets are uncertain, and outcomes are never guaranteed. Always do your own research and consider multiple perspectives.
For additional views, scenarios, and ongoing updates, follow more analysis on investingLive.com, where we break down markets using structured, data-driven approaches designed to support both traders and long-term investors.
Oh, and it sure helps to have Nasdaq futures at a new all time high today, isn't it, bulls? What may come next? Hop over to https://t.me/investingLiveStocks and stay tuned at investingLive.com