
FUNDAMENTAL OVERVIEW
USD:
The US dollar started the week on a positive note following rising tensions in the Strait of Hormuz. Yesterday, we got reports and denials about Iran firing on US ships in the Strait which gave the greenback a boost.
Trump said the US sank 6 Iranian fast boats while Iran denied it. Iran also launched a surprise attack against the UAE oil route that bypasses the Strait of Hormuz in Fujairah. This latest escalation is likely to keep the US dollar supported as the risk sentiment stays more on the defensive.
Trump has played things down for now, but the situation could worsen quickly. Overall, we are now in a consolidation phase as we await the next key development in this US-Iran stalemate.
The Fed is slowly abandoning the easing bias amid resilient US data and elevated energy prices. The reopening of the Strait could weigh on the greenback in the short-term as oil prices will likely crater and rate cut bets will increase.
After that though, the focus will quickly turn back to the Fed and the economic data. With the end of the war, the increase in economic activity could keep inflation higher for longer and eventually even require rate hikes to bring it sustainably back to the 2% target that the Fed has been missing since 2021.
INR:
On the INR side, the US-Iran stalemate and rising tensions in the Strait of Hormuz keep weighing on the currency as the Indian Rupee now flirts with new record lows against the greenback.
The INR will likely remain under pressure as long as the situation in the Strait of Hormuz remains unresolved.
In the big picture, the Indian Rupee remains on a bearish structural trend against the US dollar, so the dip-buyers will likely look for opportunities around strong technical levels to keep pushing into new highs.
USDINR TECHNICAL ANALYSIS – DAILY TIMEFRAME
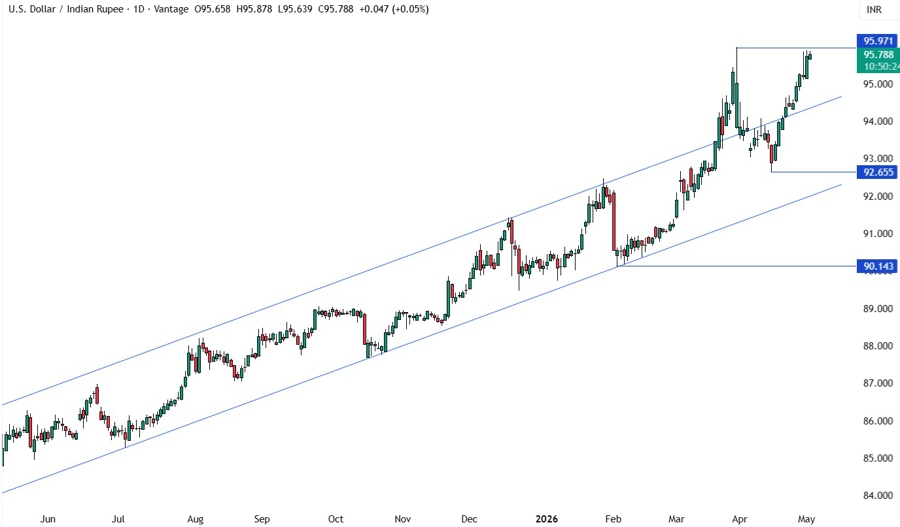
On the daily chart, we can see that USDINR has now basically reached the March high around the 96.00 handle. This is where we can expect the sellers to step in with a defined risk above the high to position for a drop back into the upper bound of the channel. The buyers, on the other hand, will look for a break to increase the bullish bets into new highs.
USDINR TECHNICAL ANALYSIS – 4 HOUR TIMEFRAME
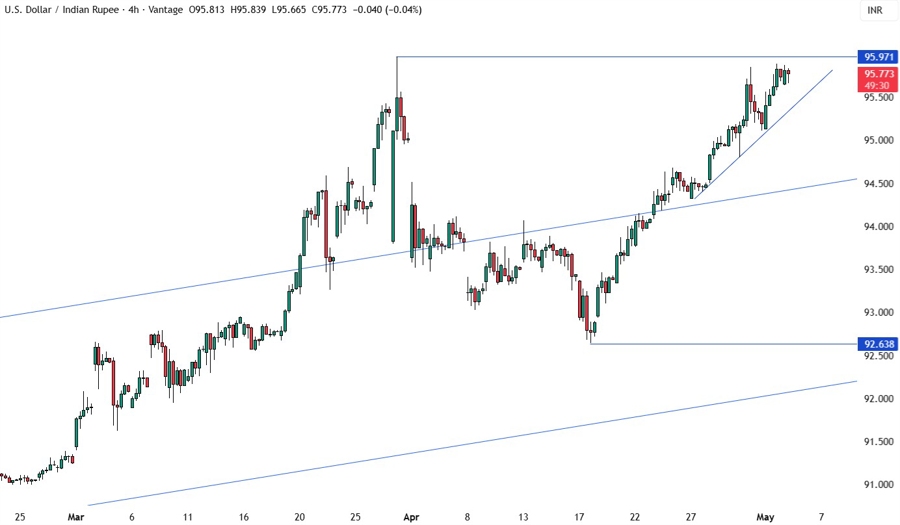
On the 4 hour chart, we have an upward trendline defining the current momentum. We can expect the buyers to continue to lean on the trendline with a defined risk below it to keep pushing into new highs. The sellers, on the other hand, will look for a break to pile in and target a drop back into the upper bound of the channel.
USDINR TECHNICAL ANALYSIS – 1 HOUR TIMEFRAME
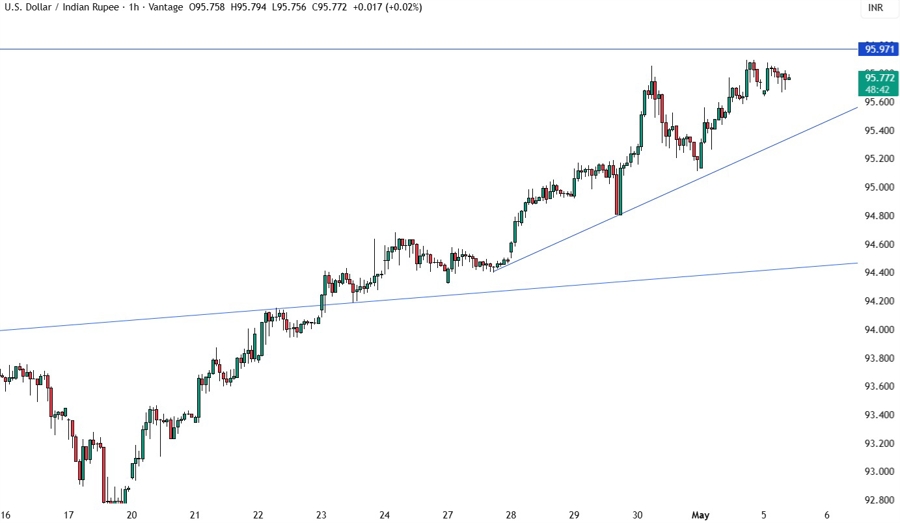
On the 1 hour chart, there’s not much we can add here as the buyers will likely continue to lean on the trendline to keep pushing into new highs, while the sellers will look for a rejection around the March high or wait for a break below the trendline to position for new lows.
UPCOMING CATALYSTS
Today we get the US ISM Services PMI and the US Job Openings data. Tomorrow, we have the US ADP report. On Thursday, we get the latest US Jobless Claims figures. On Friday, we conclude the week with the US NFP report and University of Michigan Consumer Sentiment survey.


